





Introduction
Spike traffic 대응용 초고속 autoscaling을 위한 방법과 이를 위한 activescale 이란 이름의 HPA용 custom metric server 소개이다. activescale 은 CPU, Memory 뿐 아니라 active request, active connection을 HPA signal로 사용 가능케 하고, push 방식을 사용함으로써 custom metric 사용의 대표적 솔루션인 KEDA의 단점을 해결한다. 기존 방식(Metric Server 기반)보다 짧게는 20s, 길게는 1분 이상 먼저 부하 인지가 가능하여 Spike 대응에 매우 효과적이다.
 https://github.com/anyflow/activescale
빠른 autoscaling은 spike traffic 대응 뿐 아니라 spike를 대비한 상시 resource buffer를 크게 줄일 수 있기에, k8s workload의 안정성, 효율성 동시 확보에 관하여 1/2, k8s workload의 안정성, 효율성 동시 확보에 관하여 2/2의 주요 주제였던 안정성과 효율성 모두에 크게 기여한다.
Summary
- 빠른 autoscaling은 spike traffic 대응 뿐 아니라 spike를 대비한 상시 resource buffer를 크게 줄일 수 있다.
- active request / connection이 CPU, Memory metric은 traffic 부하를 훨씬 빠르게 잡아낸다. 따라서 traffic 중심의 workload를 위한 scaling 지표로 쓰기에 좋다.
activescale은 active request / connection 및 metric 수집에 push 방식을 사용하는 HPA용 custom metric server이다.
| 단계 | 기존 방식 (Metrics Server) | active request + KEDA 방식 | activescale 방식 |
|---|---|---|---|
| 부하 인지(임계 신호 생성) 지연 | CPU/Memory: 10~60s | active request: 즉시 | active request: 즉시 |
| 수집/집계 지연 | metric server scrape interval: 15 ~ 60s (default 60s; tuning 가능) | prometheus scrape interval: 60s (default; tuning 가능) | Envoy push: 5s + α (Envoy default - stats_flush_interval; tuning 사실 상 불가, α는 custom metric server 처리 지연, 1s 미만) |
| 인지 지연 | HPA: 15s (k8s 순정과는 달리, EKS 등에서 tuning 불가) | HPA + KEDA: 25s ~ 45s (KEDA default: 30s. tuning 가능) | HPA: 15s |
| 지연 총합 | 40 ~ 135s | 85s ~ 105s | 20s + α |
| 개선 효과 및 시사점 | 기준선 | -45s ~ 30s 수집, 집계, 인지 지연으로 인해 기존 방식보다 더 느릴 수도 | 20s ~ 115s - α |
부하 급증 시 장애 신호의 발생 순서
다음은 느린 scaling이 어떻게 장애로 이어지는지와 k8s / node metric 대비 active request/connection metric이 얼마나 부하를 빠르게 잡아내는지를 보여주어, active request/connection metric이 1단계에서 과부하를 포착하는 반면, tail latency는 3단계, CPU는 5단계, memory는 6단계부터 신호를 드러내는 시간 차이를 드러낸다.
- 동시요청(in-flight) ↑ → 큐/대기 ↑ → tail latency ↑ → (비용구조 악화) → GC/메모리 압력 ↑ → CPU saturation/스로틀링 ↑ → 타임아웃/리트라이 ↑ → OOM/크래시
- 참고: tail latency(P95/P99)는 active request 지표가 없을 경우 매우 유용한 선행 지표
| 단계 | timestamp* | 현상 | k8s / node metric | Envoy / Istio metric |
|---|---|---|---|---|
| 0. 정상 | t0 | 정상 처리 | CPU throttling 0, container_memory_working_set_bytes 안정 |
envoy_http_downstream_rq_active 안정 |
| 1. 유입 압력 | t0 ~ t+2s | 동시요청 급증 | 아직 큰 변화 없음 | envoy_http_downstream_rq_active ↑, envoy_http_downstream_cx_active ↑ |
| 2. 소프트 포화 | t+2s ~ t+5s | 대기/큐 생성 | (앱 큐 있으면) 내부 queue depth ↑ | envoy_cluster_upstream_rq_pending_* ↑ |
| 3. Tail latency | t+5s ~ t+10s | p95/p99↑ | CPU는 아직 여유 | istio_request_duration_milliseconds_bucket p95/p99 ↑ |
| 4. 큐 가속 | t+10s ~ t+20s | 대기 폭증 | node load/runqueue 약간 ↑ | pending, active 둘 다 급증 |
| 5. CPU 비용 악화 | t+20s ~ t+40s | context-switch/overhead | container_cpu_usage_seconds_total 증가율↑ |
latency p99 급가속 |
| 6. 메모리 압력 | t+30s ~ t+60s | in-flight 버퍼로 RSS↑ | container_memory_working_set_bytes ↑ |
지연 악화 지속 |
| 7. GC/런타임 | t+40s ~ t+90s | GC 빈도/시간↑ | GC 메트릭↑, CPU 더 상승 | 처리율 둔화(istio_requests_total 증가율↓) |
| 8. CPU 포화 | t+1m ~ t+2m | throttling/100% | container_cpu_cfs_throttled_seconds_total ↑↑ |
에러율 전조 |
| 9. 타임아웃/리트라이 | t+2m ~ t+3m | 5xx/timeout 폭증 | istio_requests_total{response_code=~"5..0"} ↑, envoy_cluster_upstream_rq_timeout ↑ |
|
| 10. 커널 병목 | t+3m ~ t+4m | backlog/conntrack | conntrack, socket buffer pressure | envoy_http_downstream_cx_active 비정상 유지 |
| 11. OOM/크래시 | t+3m ~ 수분 | 프로세스 종료 | container_oom_events_total, OOMKilled 이벤트 |
처리량 급락 |
왜 Active Request인가?
-
리틀의 법칙(Little’s Law):
에 근거. 즉, active request는 처리량과 지연 모두를 반영하는 지표임. 처리량이 올라가도 증가하고, 지연이 증가해도 올라가는 지표이다. -
CPU / memory보다 지표로 매우 우수: active request는 장애가 터지기 10~60초 전에 먼저 임계 신호를 만드는 반면, CPU·memory는 장애 후 또는 직전에야 만듦. 특히 memory는 scale-in 관점에서도 지나치게 느리다.
CPU/Memory metric의 지연 발생 원인- 누적·평균 지표 구조: CPU/Memory는 순간 이벤트가 아니라 특정 시간 window 동안 누적된 사용량의 평균이 임계치를 넘을 때만 신호가 만들어짐.
- 런타임 완충 메커니즘: GC,캐시, 버퍼 등으로 과부하를 잠시 흡수해 실제 고갈 전까지 임계 신호 생성을 지연.
- 포화 이후 비선형 증폭: CPU throttling, page fault, reclaim 같은 현상은 이미 성능이 무너진 뒤에야 급격히 지표가 튐.
scale-in의 경우는 더욱 크게 CPU, Memory에서 지연이 발생- 누적·평균 잔상: 부하가 줄어도 CPU/Memory는 이전 window의 높은 사용량이 섞여 한동안 높은 값으로 남음.
- 메모리 반환 지연: 요청이 줄어도 힙·캐시·page cache가 즉시 회수되지 않아 working set이 오래 유지.
- 비대칭 반응성: CPU는 비교적 빨리 내려오지만, Memory는 하강 경로가 매우 완만해 scale-in 신호 생성이 특히 늦어짐.
-
runtime 환경 의존성 없음: runtime 환경(e.g. java, go, python)에 대한 의존성이 없어 universal하게 사용 가능
-
KPA의 단일 지표: concurrent request는 KPA(Knative Pod Autoscaler)의 단일 지표로 사용 중(default의 경우). KPA는 k8s 기반 서버리스 운용의 사실상 de facto 표준임.
concurrent request = (active + pending) request
- active request: Envoy가 현재 업스트림으로 전달되어 실제 처리 중인 in-flight 요청
- pending request: 업스트림 커넥션/슬롯 부족 등으로 아직 전달되지 못하고 upstream 큐에서 대기 중인 요청(envoy/istio에는 downstream에는 없고, 오직 upstream에만 존재)
istio_requests_total: 완료 기준. concurrent request는 처리/대기 중 기준.
active request 기반 scalers, 그리고 한계
앞서 잠시 언급했지만, activescale 과 동일하게 active request와 push 방식을 사용하는 KPA(Knative Pod Autoscaler)란 솔루션(FaaS 서비스에서 많이 사용한다고)이 이미 존재한다. 하지만 KPA는 별도의 activator란 workload에 sidecar까지 요구하여 런타임 아키텍처 복잡도를 늘리는 약점을 함께한다(activescale 대비 순수 event driven인 점은 상대적 장점).
- 현실적 타협: Istio/Envoy가 기본으로 제공하는 active request 지표인
envoy_http_downstream_rq_active+ KEDA 사용. - Autoscaling은
envoy_http_downstream_rq_active만으로 scale-out하고, scale-in은envoy_http_downstream_rq_active+stabilizationWindowSeconds으로 thrashing을 방지 - KPA도 같은 철학이며,
stabilizationWindowSeconds대신 request queuing으로 안정성을 확보한다는 차이만 존재.
하지만 KEDA는 자체 polling 주기를 가질 뿐 아니라, 전용 DB(Prometheus 등)의 수집 주기에 종속된다. 두 주기를 모두 기다리면 오히려 기존 CPU, Memory 기반의 HPA 방식보다 느려진다(Summary 섹션 참고).
상기 한계의 해결: activescale
activescale은 active request 뿐 아니라 active connection metric 을 지원하며, push 방식을 사용함으로 metric 수집 지연을 제거한다. 또한 KPA와 같이 별도의 workload(특히 pod 별 proxy)를 요구하지 않기에 단순한 런타임 아키텍처를 유지 가능하다. 아래는 activescale의 내부 구조이다.
graph LR
    PodA["📦 service pod A<br/>Istio/Envoy"]
    PodB["📦 service pod B<br/>Istio/Envoy"]
    PodC["📦 service pod C<br/>Istio/Envoy"]

    Agg(("⚙️ <b>activescale<b/><br/>(Custom Metric Adapter. Stateless, HA)"))

    Redis[("🗄️ shared memory<br/>(e.g., Redis)")]

    KEDA{{"🚀 HPA<br/>(average computed by HPA)"}}

    PodA -."1. Push<br/>(5s delay)".-> Agg
    PodB -."1. Push<br/>(5s delay)".-> Agg
    PodC -."1. Push<br/>(5s delay)".-> Agg

    Agg ==>|2. update + TTL| Redis

    KEDA --"3. Query"--> Agg
    Redis -."4. metric value (per pod)".-> Agg
    Agg --"5. metric value (per pod)"--> KEDA

    style Redis fill:#E3ECF8,stroke:#6E8FB3,stroke-width:2px,color:#000
    style KEDA fill:#DDEFD8,stroke:#7DA67D,stroke-width:2px,color:#000
    style Agg fill:#E3ECFF,stroke:#6E8FB3,color:#000
    style PodA fill:#FAFAFA,stroke:#999
    style PodB fill:#FAFAFA,stroke:#999
	  style PodC fill:#FAFAFA,stroke:#999
5초마다 Istio/Envoy는 active request/connection metric을 activescale에 push하고, activescale은 Prometheus를 대신하여 수신한 metric을 즉시 합산하여 shared memory(e.g., Redis)에 저장했다가 HPA가 요청(default 15초 polling)하면 shared memory에 저장된 합산값을 전달한다.
다음은 Istio에서 custom metric server로 metric push를 위한 설정 예이다.
apiVersion: networking.istio.io/v1beta1
kind: ProxyConfig
metadata:
  name: metrics-push
  namespace: istio-system
spec:
  envoyMetricsService:
    address: custom-metric.observability.svc.cluster.local:9000

  proxyStatsMatcher:
    inclusionRegexps:
      - ".*downstream_rq_active.*"
      - ".*downstream_cx_active.*"
Redis 연동은 아래 요구에 대응하기 위함이다.
- 분산 합산의 어려움: 지표가 여러 Aggregator 복제본으로 분산되어 들어올 때, 전체 합산값을 구하기 위해 복제본 간 데이터 동기화가 필요.
- Consistent Hashing 요구: Envoy가 지표를 보낼 때나, HPA가 조회할 경우 모두에서 특정 pod를 찾아가야하는 consistent hashing 요구 발생.
이로서activescale은 단순한 인터페이스(gRPC/HTTP) 역할만 수행하며, 모든 상태는 Redis가 관리. 이를 통해 완전한 무상태(Stateless) HA 구성이 가능해진다.
참고로 External metrics API는 KEDA 등 타 APIService가 사용할 가능성이 높으므로 Custom metrics API 사용한다(대신 타 Custom metrics Adapter를 못 씀. 예컨데 Prometheus Adapter - 이게 필요하면 KEDA 쓰면 되긴 하지만).
아래는 Istio/Envoy 및 kube-apiserver 연동을 위해 사용한 라이브러리이다. activescale이 golang으로 작성된 이유는 이들 라이브러리가 golang인 이유가 컷다.
https://github.com/envoyproxy/go-control-planehttps://github.com/kubernetes-sigs/custom-metrics-apiserver테스트 결과
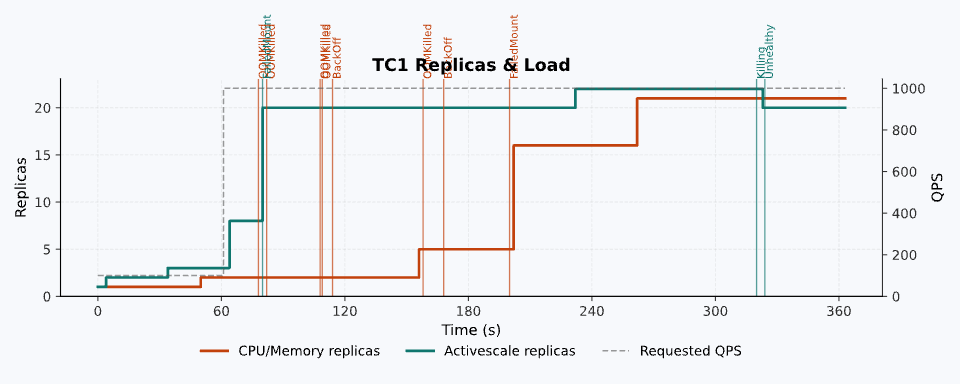
https://github.com/anyflow/activescale/blob/main/doc/test-results-kr.md아래 테스트 sample 예는 CPU/Memory 기반 HPA와의 spike traffic 대응 차이를 보여준다. Activescale HPA(푸른색)은 약 3초 만에 scaling 시작하여 약 25초 만에 근사 최대 Pod 도달, Spike 부하를 전체 수용하는 반면, CPU/Memory HPA(붉은색)은 약 1분 30초 후에야 scaling 시작하고, 3분을 훌쩍 넘겨서야 근사 최대 pod 갯수에 도달하여, 해당 지연 중 장애를 일으켰다.
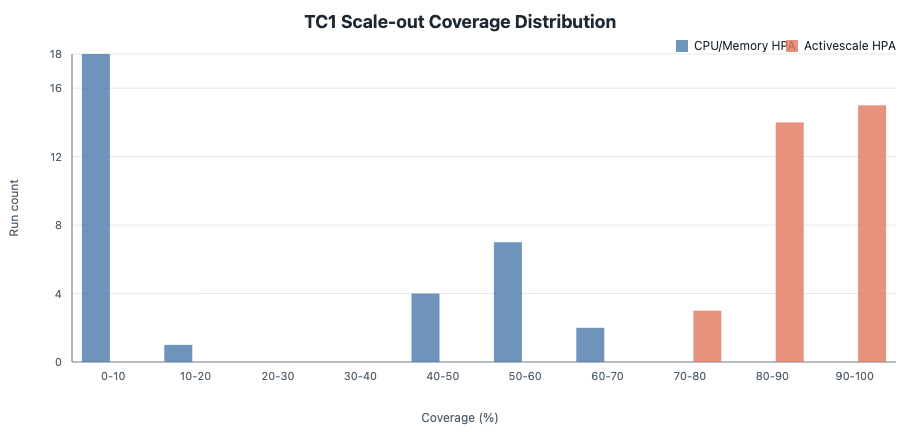
아래는 spike traffic 대응 테스트를 32회 실행한 결과로, Scale-out Coverage는 이상적인 scale-out에 필요한 replica × 시간 면적 중 실제 replica가 충족한 비율이며, 100%에 가까울수록 부하 증가에 더 빠르고 충분하게 대응했음을 의미한다. 결과는 위 단일 sample보다 더욱 극적임을 보여준다.
- CPU/Memory HPA Coverage: min 0.00%, median 5.66%, max 63.54%. 12/32 sample에서 0.00%(사실상 scale-out 없음).
- Activescale HPA Coverage: min 75.88%, median 89.47%, max 97.86%. 32/32 sample에서 우세.
activescale 사용법
HPA를 그대로 사용하기에 CPU, Memory 기반의 사용법과 별반 다르지 않으며, CPU, Memory metric과 동시에 운용도 가능하다. 자세한 사용법은 아래를 참고한다.
https://github.com/anyflow/activescale/blob/main/doc/guide-kr.md
Comments