

Introduction
Prometheus metric의 특성과 Istio metric의 interval에 대해 논한다. Prometheus는 일반적인 DB와는 달리 pull 방식으로 데이터를 수집함과 동시에, Grafana 등에서 마주치는 데이터에는 (interpolation, extrapolation에 의해 보정된) 가상의 데이터가 포함되다보니, Prometheus에 실제 어떻게 데이터가 저장되어 있는지를 유추하기가 생각보다 어렵다. 그리고 이는 데이터 정확성에 대한 파악 뿐 아니라 용량 산정/예측에도 영향을 미친다.
Summary
•
Prometheus는 Time series identifier 별로 time series를 생성한다. 즉, label value 갯수만큼 time series가 생성 즉, label 갯수에 따라 기하 급수로 time series 갯수가 증가하는 구조이다.
•
Query, 특히 range query에는 가상의 데이터가 포함된다. scrape_interval 보다 step이 작을 경우 특히 그러하다.
•
Istio에는 metric 생성 주기에 영향을 주는 ‘듯’한 여러 parameter가 있다. 그러나 타 metric과 마찬가지로 결국 scrape_interval 에 맞춰 metric sample의 timestamp가 생성된다.
Prometheus Data Model


Prometheus의 모든 데이터는 time series로 이루어지며, Time series는 Time series identifier와 Samples로 구성되어, 각 Time series Identifier 마다 단일 time series 생성된다. 단, Query를 위해 임시 time series를 생성할 수도 있다.
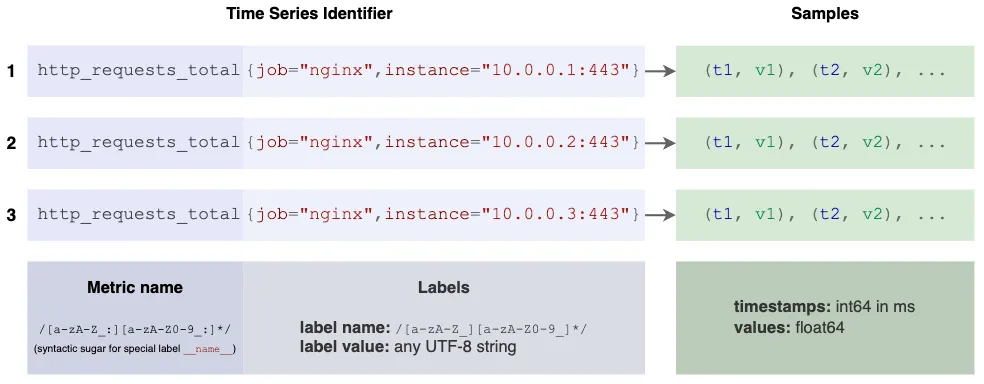
Time series identifier
Metric name와 key/value 쌍으로 이루어진 Metric label의 집합.
•
notation: <metric name>{<label name>=<label value>, ...}
•
Metric name
◦
사용 가능 문자: 정규식 [a-zA-Z_:][a-zA-Z0-9_:]* 에 일치해야(첫 문자는 숫자 불가).
•
Metric label
◦
동일 metric name에 대한 모든 label 조합을 지원
◦
label에 대한 추가, 변경, 삭제는 새로운 time series를 생성
◦
label (name)에 사용 가능 문자: [a-zA-Z_][a-zA-Z0-9_]* 에 일치해야(첫 문자는 숫자 불가). __ prefix는 내부 사용으로 예약되었다고.
◦
label value: unicode 사용 가능. label value가 없으면 해당 label은 존재하지 않는 것으로 처리.
Samples
Timestamp/value 쌍으로 이루어진 sample의 집합
•
Timestamp: microsecond 정확도
•
Value: float64 타입. version 2.40부터 native histogram을 지원한다고
•
각 value 간의 interval: Prometheus scraper의 scrape_interval 에 의해 결정됨. Default는 1분(global.scrape_interval에서 수정 가능)로 각 scrap config마다 별도 지정 가능.
Data model에 관한 주요 Prometheus 특성 몇가지
Label 갯수와 time series 갯수와의 관계
늘어난 각 label 별 가능 value 갯수만큼 늘어난다. 위 그림에서 method 와 path 란 labels가 추가되고 method value 갯수가 5, path value 갯수가 10일 경우, 기존 3개의 Samples에서 3 * 5 * 10, 즉, 무려 150개로 늘어난다. label 관리가 interval보다 더 중요하다는 이야기.
모든 label 조합 지원을 위해 각 조합마다 time series가 생성되어야 하는 것은 아닌지?
생성 불필요. 위 그림 예의 경우 예컨데 http_requests_total{job="nginx"} 로 query할 경우, 3개 time series 내 각 data point 중 동일 timestamp를 가진 data point에 대해서만 처리 가능해보인다(e.g. series 1에 t3에 해당하는 value가 없다면 이를 제외하고 처리. 처리 방법은 평균을 사용하여).
Step Parameter? Prometheus co-creator인 Julius Volz의 관련 답변 외

•
Step parameter는 인접 두 sample에 대한 간격을 지정. Range query에서 사용.
•
Prometheus UI의 Default Step은 graph range를 250 등분한 값. 예컨데 range가 250분이면 step은 1분(여기서 range가 range vector를 의미하는지, start/end date를 의미하는 것인지 불분명)
•
Query 내 추출 가능한 최대 sample 갯수는 11k. 다만, 오직 range query에만 해당.
Interpolation, Extrapolation에 관하여
지정된 step 내에 sample이 없거나(e.g. step보다 scrape_interval 이 클 경우), (range vector의 것이건 Query Time Range이건 간에) 지정된 범위 내에 sample이 없을 경우, interpolation, extrapolation을 사용하여 가상의 sample 생성하여 step을 보정하거나 아예 누락시키는 듯.
아래는 공식 문서에서 언급한 interpolation, extrapolation 함수이나, 원리 상 타 함수도 이를 사용하여 가상 sample을 생성할 수도(chatGPT 등은 아래 함수를 포함한 여타 함수들에 대해 특히나 interpolation 사용을 언급).


•
Interpolation: historgram_quantile()
•
Extrapolation: increase(), rate() , delta()
Instio의 Metric Interval에 대하여
Summary
•
Istio 역시 Prometheus scraper의 scrap_interval을 따름: scrap_interval 에 따라 각 Metric sample의 timestamp가 결정된다.
•
유관해보이는 Istio configuration인 stats_flush_interval, reportingInterval 은 영향을 미치지 않는다. 적어도 default 값을 그대로 유지하는 선에서는.
테스트 #1: scrap_interval 에 의한 timestamp의 생성 여부 확인
•
테스트 환경: Prometheus scraper의 scrap_interval 을 10초로 설정(default는 1분임)
◦
참고: Prometheus scraper의 service discovery 환경에서 Istio sidecar의 metric 수집을 이루는 job은 kubernetes-pods 임(prometheus annotation이 pod에 위치하므로. 예컨데 kubernetes-service-endpoints job의 경우 service endpoint 대상이다(이 경우 service annotation에 prometheus annotation이 위치해야 함).
•
테스트 방법: 주어진 기간 내 time series의 모든 데이터를 Prometheus에서 추출하여 각 timestamp간의 interval이 10초인지 여부를 확인
•
command: 최근 1분간의 특정 time series raw 데이터 추출. 참고로 metric_name[range] 로 query하면 raw data가 추출된다(근거; If your goal is to extract raw data at the resolution that it was scraped over 30d, you could run an instant query like "my_metric[30d]" - Prometheus co-creator 왈).
# 아래에서 지정된 labels는 istio_requests_total metric에 대한 단일 time series를 추출하기 위한 조건임
curl 'http://prometheus-server.cluster.svc.cluster.local:80/api/v1/query' --data-urlencode 'query=istio_requests_total{app="dockebi", request_path="/v1/stuff", request_method="GET", connection_security_policy="mutual_tls", version="tick"}[1m]'
Bash
복사
•
Result: 해당 time series identifer에 대한 10s 간격의 5개의 sample이 추출됨
{
"status": "success",
"data":
{
"resultType": "matrix",
"result":
[
{
"metric": # Timeseries Identifier
{
"__name__": "istio_requests_total",
"app": "dockebi",
"connection_security_policy": "mutual_tls",
"request_method": "GET",
"request_path": "/v1/stuff",
"version": "tick",
...
},
"values": # Samples(Timestamp + value set)
[
[1722812639.648, "1835"],
[1722812649.648, "1844"],
[1722812659.648, "1852"],
[1722812669.648, "1852"],
[1722812679.648, "1852"],
],
},
],
},
}
JSON
복사
테스트 #2: scrap_interval 이외의 config가 metric 생성에 영향을 미치는지 여부 확인
•
테스트 배경: Istio에는 stats_flush_interval, reportingInterval 등 metric 생성에 관련있어 보이는 여러 설정이 존재(이들에 대해서는 Appendix 참조).
•
테스트 환경: 1 RPS의 request 유입.
•
테스트 방법: 초 단위로 istio-proxy의 /stat/prometheus 를 호출하여 istio_requests_total 값이 1 RPS 또는 유사 속도로 로 변경되는지 확인.
•
테스트 결과: 1 RPS 또는 유사 속도로 변경.
? curl -s -i -w "Time: $(date +"%Y-%m-%d %H:%M:%S")\n" http://10.244.3.57:15020/stats/prometheus | grep -E 'Time:|istio_requests_total'
# TYPE istio_requests_total counter
istio_requests_total{...,request_path="/v1/stuff"} 2977
Time: 2024-08-04 23:39:00
Total Time: 0.010529s
? curl -s -i -w "Time: $(date +"%Y-%m-%d %H:%M:%S")\n" http://10.244.3.57:15020/stats/prometheus | grep -E 'Time:|istio_requests_total'# TYPE istio_requests_total counter
istio_requests_total{...,request_path="/v1/stuff"} 2979 # 2 증가
Time: 2024-08-04 23:39:03 # 3초 간격 뒤
Total Time: 0.010872s
? curl -s -i -w "Time: $(date +"%Y-%m-%d %H:%M:%S")\n" http://10.244.3.57:15020/stats/prometheus | grep -E 'Time:|istio_requests_total'# TYPE istio_requests_total counter
istio_requests_total{...,request_path="/v1/stuff"} 2980 # 1 증가
Time: 2024-08-04 23:39:04 # 1초 간격
Total Time: 0.010158s
? curl -s -i -w "Time: $(date +"%Y-%m-%d %H:%M:%S")\n" http://10.244.3.57:15020/stats/prometheus | grep -E 'Time:|istio_requests_total'
# TYPE istio_requests_total counter
istio_requests_total{...,request_path="/v1/stuff"} 2983 # 3 증가
Time: 2024-08-04 23:39:07 # 3초 간격
Total Time: 0.010290s
Bash
복사
상기 Istio scrap interval에 영향을 미치는 듯한 오해를 일으키는 설정들
•
honor_timestamp: prometheus에는 honor_timestamps 란 field가 scrap_config 에 있어, 수집 대상 metric이 가진 timestamp를 유지하는 옵션이 있다. default는 true.
•
stats_flush_interval: Envoy는 성능을 위한 조치로서 매 순간 metric을 기록하지 않고 주기적으로 flush함. Istio의 stat filter가 이를 사용하는지는 확인되지 않았다. default 값은 5초.
•
TCP의 경우 metric interval이 15초 간격으로 설정되어 내부적으로 설정되어 있다고. 오래된 자료이다.

•
TCP의 경우 Istio Telemetry API의 reportingInterval 이란 field가 있어 metric 주기를 설정. TCP에 대해서만 논하고 HTTP.. 특히 long duration에 대해서는 추후에 지원한다고.


참고로 아래 내용은 위 Telemetry의 reportingInterval 에 해당하는 내용이 아닌가 싶다.
