




Introduction
OTel(OpenTelemetry) Collector로 Prometheus (scraper - agent mode)를 교체하는 방법에 대한 설명이다. OpenTelemetry의 사용자 관점 Overview 및 OpenTelemetry 설치 준비: Operator 설치 의 연장선 상에 위치한 OpenTelemetry Collector의 상세 검토 중 하나이다.

Summary
- OTel Collector로 Kubernetes resource metric 스크래핑을 위한 Prometheus를 대체 가능하다.
- 다수의 scraping 대상으로 인한 특정 pod로의 부하 쏠림을 해결하기 위해 Target Allocator가 제공된다.
- Prometheus로 전달에는 OTLP 사용 이외에도 기존과 동일한 pull 방식, prometheus format의 push 방식이 지원된다.
Architecture
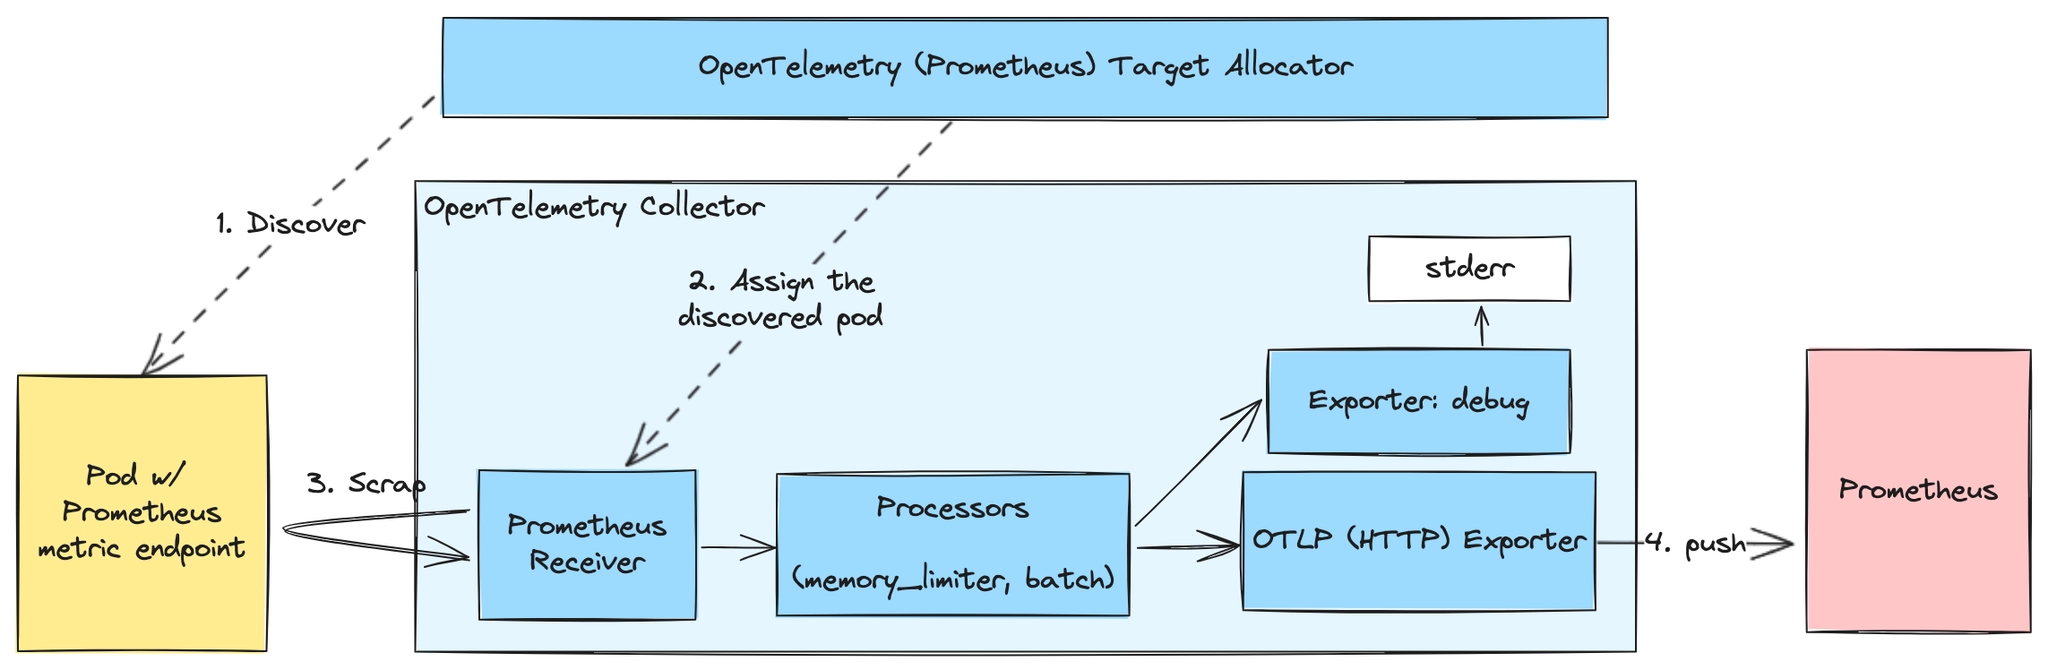
OpenTelemetry Collector 및 Target Allocator의 Kubernetes Metric scrapping 구조
위 그림은 OpenTelemetry Collector로 Prometheus (scraper)를 교체했을 때의 아키텍처이다.
좌측 노란 박스는 scraping 대상 Kubernetes resources를, 푸른 박스는 OpenTelemetry components로 OpenTelemetry Collector와 Target Allocator를, 붉은 박스는 metric 저장소로서의 Prometheus 및 scraper(오직 OpenTelemetry Collector에서만 scrap)로서의 Prometheus를 나타낸다. 실선은 데이터의 흐름을, 점선은 관계를 의미한다.
각 components에 대한 설명은 아래부터 이어진다.
Components
Architecture 에서 식별된 각 components에 대한 설명이다.
Prometheus Receiver
 https://github.com/open-telemetry/opentelemetry-collector-contrib/tree/main/receiver/prometheusreceiver
-
Prometheus format의 metric을 수집하는 OTel receiver이다.
-
stateful 동작으로 인하여 Collector는
statefulset배포 방식이 요구된다. 이로 인해 발생 가능한 데이터 중복 및 부하 분산 등의 문제를 해결하기 위해 OTel Operator는 Target Allocator를 함께 제공한다. 이에 대해서는 Target Allocator 에서 자세히 다룬다. -
Prometheus (scraper)와 동일한 동작을 위해, Prometheus (scraper) 설정된 scraping config를
config.scrape_configs에 동일하게 설정한다. 여기서는 Prometheus helm chart의 default scraping config를 그대로 가져왔다. -
config.scrap_configs설정 시 Prometheusscrap_config에서 replacement key인$를$$으로 변경해야 한다. 이렇게 하지 하지 않으면, 아래와 같은 오류 발생한다. 해결안 출처:GitHub opentelemetry-operator(’…The usage of $$in the replacement keys in the example above is based on …’)오류 로그 예
BASH2024-03-24T03:31:48.962Z debug scrape/scrape.go:1400 Scrape failed {"kind": "receiver", "name": "prometheus", "data_type": "metrics", "scrape_pool": "kubernetes-pods", "target": "http://:/stats/prometheus", "error": "Get \"http:///stats/prometheus\": http: no Host in request URL"}
memory_limiter, batch Processors
memory_limiter 는 메모리 과다 사용 사전 방지용이고 batch 효율적 data 처리를 위해 수집된 metric을 모아서 처리 가능하게 한다. 이에 대해서는 OpenTelemetry: Memory Limit, Batch Processor 에서 자세히 다룬다.
Exporters
Prometheus로 데이터를 보내기 위한 방법에는 무려 세 가지나 있는데, 기존과 동일하게 Prometheus에서 scrap하는 pull 방식과 Collector가 직접 Prometheus로 전달하는 push 방식, 마지막으로 OTLP exporter의 이용이다. 이 중 추천은 OTLP exporter로 이를 먼저 설명한다. 이외에 debug exporter가 있는데 이는 디버깅 용으로 stderr로 데이터를 보내며 이에 대해 역시 별도의 글에서 다룬다.
otlphttp Exporter
HTTP 기반의 OTLP exporter로, Prometheus는 HTTP 기반의 OTLP receiver를 자체적으로 지원한다. OTLP는 기본적으로 push 방식이기에, pull 방식 대비 부하 분산 및 스파이크 방지의 이점과 함께 Prometheus Remote Write Exporter의 일부 OTLP 포맷을 지원 못하는 제약마저 없다. 테스트 결과 prometheus format의 signal임에도 정상 저장되는 듯 하다. 대용량 Prometheus 솔루션인 Cortex 역시 OTLP를 지원하는 듯.
이를 사용하려면 Prometheus에서 --enable-feature=otlp-write-receiver feature flag을 사용해야 한다. endpoint는 /api/v1/otlp/v1/metrics 이다.
 exporter/otlphttpexporter/README.mdopen-telemetry · 2026-10-22 업데이트
 https://prometheus.io/docs/prometheus/latest/querying/api/
prometheus Exporter
https://github.com/open-telemetry/opentelemetry-collector-contrib/blob/main/exporter/prometheusexporter/README.mdPrometheus (scraper)가 Prometheus format의 data를 scrap할 수 있도록 노출한다. 여기서는 endpoint 설정 이외에 특별한 것은 없다. 이 exporter를 사용할 경우 Prometheus (scraper)를 그대로 사용하게 되는데, 해당 Prometheus에 아래와 같이 설정함으로 오직 이 Collector에서만 scrap하도록 한다.
...
  - job_name: otel-prometheus-collector # only collect metrics from otel-collector
    static_configs:
      - targets:
          - otel-prometheus-collector.cluster.svc.cluster.local.:9090
...
prometheusremotewrite Exporter
https://github.com/open-telemetry/opentelemetry-collector-contrib/blob/main/exporter/prometheusremotewriteexporter/README.mdPrometheus (scraper) 없이 직접 Prometheus에 전달(push)할 때 사용한다. 근데 Non-cumulative monotonic, histogram, summary 타입의 OTLP metric은 export 못한다고. 그럼에도 아래 Grafana의 글은 부하 분산 및 스파이크 방지의 이유로 이 방식을 추천하는데, 처리 데이터 범위가 좁혀진다는 점을 고려한다면 크게 와닺지 않는다.
 https://grafana.com/blog/2023/07/20/a-practical-guide-to-data-collection-with-opentelemetry-and-prometheus/

참고로, --web.enable-remote-write-receiver feature flag와 함께 Prometheus를 실행해야 Prometheus가 데이터를 받을 수 있다. 해당 endpoint는 /api/v1/write 이다.
Target Allocator
https://github.com/open-telemetry/opentelemetry-operator/tree/main/cmd/otel-allocatortargetAllocator.enabled: true 설정 시 collector와 함께 자동 생성된다.
scrap 대상이 많아지면 Collector pod도 scaling하게 되는데, Prometheus Receiver의 stateful 속성으로 인해 scrap 대상이 상시 고정되는데 이는 특정 pod에 부하가 몰릴 가능성이 높아진다는 뜻이다. Target Allocator는 이를 완화시키기 위한 별도의 deployment으로, scrap target discovery와 이를 처리할 Collector를 할당한다. 이외에 Prometheus CR(Custom Resource) discovery 기능도 갖는다고.
아래는 Target Allocator 기반의 Collector 처리 순서를 나타낸다.
sequenceDiagram
  participant Target Allocator
  participant Metrics Targets
  participant OTel Collectors
  Target Allocator ->>Metrics Targets: 1. Discover Metrics targets
  Target Allocator ->>OTel Collectors: 2. Discover available Collectors
  Target Allocator ->>Target Allocator: 3. Assign Metrics targets
  OTel Collectors ->>Target Allocator: 4. Query TA for Metrics endpoints scrape
  OTel Collectors ->>Metrics Targets: 5. Scrape Metrics target
Target Allocator 동작 방식. 출처: https://github.com/open-telemetry/opentelemetry-operator/tree/main/cmd/otel-allocator
설치 방법
Appendix: 전체 코드 에 대해 kubectl apply 를 실행한다. 앞서 설명한 내용를 적용하고자 할 경우 환경에 관계 없이 별도 수정없이도 동작할 것이라 예상한다. 다만, prometheus exporter를 사용하도록 prometheusremotewrite 에 대해서는 주석화되어 있는데, prometheusremotewrite 를 사용할 경우 적당히 연결할 prometheus endpoint로 수정해야 한다.
Appendix: 동적 scrap 대상 지정용 prometheus.io annotation 목록
metadata:
  annotations:
    prometheus.io/scrape: true # Only scrape services that have a value of `true``true`, except if `prometheus.io/scrape-slow` is set to `true` as well.
    prometheus.io/scrape-slow: false
    prometheus.io/path: /prometheus # If the metrics path is not `/metrics` override this.
    prometheus.io/port: 15020 # If the metrics are exposed on a different port to the service then set this appropriately
    prometheus.io/scheme`: # If the metrics endpoint is secured then you will need to set this to `https` & most likely set the `tls_config` of the scrape config.
    prometheus.io/param_<parameter>`: # If the metrics endpoint uses parameters then you can set any parameter
    prometheus.io/probe`: # Only probe services that have a value of `true`
prometheus.ioKubernetes annotation이란Prometheus에게 metric 수집 대상임을 알리는 방법으로 예컨데 아래는 Istio sidecar annotation의 예이다.
YAMLmetadata: annotations: prometheus.io/scrape: 'true' # scrap 대상임을 알림 prometheus.io/path: /stats/prometheus # scrap에 사용되는 endpoint path prometheus.io/port: '15020' # scrap에 사용되는 endpoint의 portPrometheus에게 metric 수집 대상임을 알리는 방법으로 예컨데 아래는 Istio sidecar annotation의 예이다.
YAMLmetadata: annotations: prometheus.io/scrape: 'true' # scrap 대상임을 알림 prometheus.io/path: /stats/prometheus # scrap에 사용되는 endpoint path prometheus.io/port: '15020' # scrap에 사용되는 endpoint의 port
Appendix: 전체 코드
앞서 설명한 내용이 담긴 OpenTelemetry Collector에 대한 manifest 뿐 아니라, 인가, 인증을 위한 Kubernetes ClusterRole, ClusterRoleBinding에 대한 manifest도 함께한다. Service Account는 Operator가 자동으로 생성하기에 이에 대한 manifest는 없다. 또한, Target Allocator는 targetAllocator.enabled 설정으로 자동 생성된다.
전체 코드
---
apiVersion: rbac.authorization.k8s.io/v1
kind: ClusterRole
metadata:
name: otel-prometheus
rules:
- apiGroups:
- ""
resources:
- nodes
- nodes/proxy
- services
- endpoints
- pods
verbs:
- get
- list
- watch
- apiGroups:
- extensions
resources:
- ingresses
verbs:
- get
- list
- watch
- nonResourceURLs:
- /metrics
- /metrics/cadvisor
verbs:
- get
---
apiVersion: rbac.authorization.k8s.io/v1
kind: ClusterRoleBinding
metadata:
name: otel-prometheus-collector
roleRef:
apiGroup: rbac.authorization.k8s.io
kind: ClusterRole
name: otel-prometheus
subjects:
- kind: ServiceAccount
name: otel-prometheus-collector
namespace: cluster
---
apiVersion: rbac.authorization.k8s.io/v1
kind: ClusterRoleBinding
metadata:
name: otel-prometheus-targetallocator
roleRef:
apiGroup: rbac.authorization.k8s.io
kind: ClusterRole
name: otel-prometheus
subjects:
- kind: ServiceAccount
name: otel-prometheus-targetallocator
namespace: cluster
---
# otel-prometheus-collector, otel-prometheus-targetallocator service accounts are created automatically
apiVersion: opentelemetry.io/v1alpha1
kind: OpenTelemetryCollector
metadata:
name: otel-prometheus
namespace: cluster
labels:
app: otel-prometheus-collector
spec:
mode: statefulset
targetAllocator:
enabled: true
podAnnotations:
prometheus.io/scrape: "true"
prometheus.io/port: "8888"
config: |
extensions:
health_check: # for k8s liveness and readiness probes
endpoint: 0.0.0.0:13133 # default
processors:
batch: # buffer up to 10000 spans, metric data points, log records for up to 5 seconds
send_batch_size: 10000
timeout: 5s
memory_limiter:
check_interval: 1s # recommended by official README
limit_percentage: 80 # in 1Gi memory environment, hard limit is 800Mi
spike_limit_percentage: 25 # in 1Gi memory environment, soft limit is 500Mi (800 - 250 = 550Mi)
exporters:
debug:
verbosity: basic # default is basic
otlphttp/prometheus:
metrics_endpoint: http://prometheus-server.cluster.svc.cluster.local:80/api/v1/otlp/v1/metrics
tls:
insecure: true
# prometheus:
# endpoint: 0.0.0.0:9090
# prometheusremotewrite: # for pushing metrics to prometheus instead of pulling of right above
# endpoint: "http://prometheus-server.cluster:80/api/v1/write"
service:
extensions:
- health_check
telemetry:
logs:
level: INFO
metrics:
address: 0.0.0.0:8888
pipelines:
metrics:
receivers:
- prometheus
processors:
- memory_limiter
- batch
exporters:
- debug
- otlphttp/prometheus
# - prometheus
# - prometheusremotewrite # for pushing metrics to prometheus instead of pulling of right above
receivers:
prometheus:
config:
scrape_configs:
- job_name: 'otel-collector'
scrape_interval: 10s
static_configs:
- targets:
- 0.0.0.0:8888
# A scrape configuration for running Prometheus on a Kubernetes cluster.
# This uses separate scrape configs for cluster components (i.e. API server, node)
# and services to allow each to use different authentication configs.
#
# Kubernetes labels will be added as Prometheus labels on metrics via the
# `labelmap` relabeling action.
# Scrape config for API servers.
#
# Kubernetes exposes API servers as endpoints to the default/kubernetes
# service so this uses `endpoints` role and uses relabelling to only keep
# the endpoints associated with the default/kubernetes service using the
# default named port `https`. This works for single API server deployments as
# well as HA API server deployments.
- job_name: "kubernetes-apiservers"
kubernetes_sd_configs:
- role: endpoints
# Default to scraping over https. If required, just disable this or change to
# `http`.
scheme: https
# This TLS & bearer token file config is used to connect to the actual scrape
# endpoints for cluster components. This is separate to discovery auth
# configuration because discovery & scraping are two separate concerns in
# Prometheus. The discovery auth config is automatic if Prometheus runs inside
# the cluster. Otherwise, more config options have to be provided within the
# <kubernetes_sd_config>.
tls_config:
ca_file: /var/run/secrets/kubernetes.io/serviceaccount/ca.crt
# If your node certificates are self-signed or use a different CA to the
# master CA, then disable certificate verification below. Note that
# certificate verification is an integral part of a secure infrastructure
# so this should only be disabled in a controlled environment. You can
# disable certificate verification by uncommenting the line below.
#
insecure_skip_verify: true
bearer_token_file: /var/run/secrets/kubernetes.io/serviceaccount/token
# Keep only the default/kubernetes service endpoints for the https port. This
# will add targets for each API server which Kubernetes adds an endpoint to
# the default/kubernetes service.
relabel_configs:
- source_labels:
[
__meta_kubernetes_namespace,
__meta_kubernetes_service_name,
__meta_kubernetes_endpoint_port_name,
]
action: keep
regex: default;kubernetes;https
- job_name: "kubernetes-nodes"
# Default to scraping over https. If required, just disable this or change to
# `http`.
scheme: https
# This TLS & bearer token file config is used to connect to the actual scrape
# endpoints for cluster components. This is separate to discovery auth
# configuration because discovery & scraping are two separate concerns in
# Prometheus. The discovery auth config is automatic if Prometheus runs inside
# the cluster. Otherwise, more config options have to be provided within the
# <kubernetes_sd_config>.
tls_config:
ca_file: /var/run/secrets/kubernetes.io/serviceaccount/ca.crt
# If your node certificates are self-signed or use a different CA to the
# master CA, then disable certificate verification below. Note that
# certificate verification is an integral part of a secure infrastructure
# so this should only be disabled in a controlled environment. You can
# disable certificate verification by uncommenting the line below.
#
insecure_skip_verify: true
bearer_token_file: /var/run/secrets/kubernetes.io/serviceaccount/token
kubernetes_sd_configs:
- role: node
relabel_configs:
- action: labelmap
regex: __meta_kubernetes_node_label_(.+)
- target_label: __address__
replacement: kubernetes.default.svc:443
- source_labels: [__meta_kubernetes_node_name]
regex: (.+)
target_label: __metrics_path__
replacement: /api/v1/nodes/$$1/proxy/metrics
- job_name: "kubernetes-nodes-cadvisor"
# Default to scraping over https. If required, just disable this or change to
# `http`.
scheme: https
# This TLS & bearer token file config is used to connect to the actual scrape
# endpoints for cluster components. This is separate to discovery auth
# configuration because discovery & scraping are two separate concerns in
# Prometheus. The discovery auth config is automatic if Prometheus runs inside
# the cluster. Otherwise, more config options have to be provided within the
# <kubernetes_sd_config>.
tls_config:
ca_file: /var/run/secrets/kubernetes.io/serviceaccount/ca.crt
# If your node certificates are self-signed or use a different CA to the
# master CA, then disable certificate verification below. Note that
# certificate verification is an integral part of a secure infrastructure
# so this should only be disabled in a controlled environment. You can
# disable certificate verification by uncommenting the line below.
#
insecure_skip_verify: true
bearer_token_file: /var/run/secrets/kubernetes.io/serviceaccount/token
kubernetes_sd_configs:
- role: node
# This configuration will work only on kubelet 1.7.3+
# As the scrape endpoints for cAdvisor have changed
# if you are using older version you need to change the replacement to
# replacement: /api/v1/nodes/$$1:4194/proxy/metrics
# more info here https://github.com/coreos/prometheus-operator/issues/633
relabel_configs:
- action: labelmap
regex: __meta_kubernetes_node_label_(.+)
- target_label: __address__
replacement: kubernetes.default.svc:443
- source_labels: [__meta_kubernetes_node_name]
regex: (.+)
target_label: __metrics_path__
replacement: /api/v1/nodes/$$1/proxy/metrics/cadvisor
# Metric relabel configs to apply to samples before ingestion.
# [Metric Relabeling](https://prometheus.io/docs/prometheus/latest/configuration/configuration/#metric_relabel_configs)
# metric_relabel_configs:
# - action: labeldrop
# regex: (kubernetes_io_hostname|failure_domain_beta_kubernetes_io_region|beta_kubernetes_io_os|beta_kubernetes_io_arch|beta_kubernetes_io_instance_type|failure_domain_beta_kubernetes_io_zone)
# Scrape config for service endpoints.
#
# The relabeling allows the actual service scrape endpoint to be configured
# via the following annotations:
#
# * `prometheus.io/scrape`: Only scrape services that have a value of
# `true`, except if `prometheus.io/scrape-slow` is set to `true` as well.
# * `prometheus.io/scheme`: If the metrics endpoint is secured then you will need
# to set this to `https` & most likely set the `tls_config` of the scrape config.
# * `prometheus.io/path`: If the metrics path is not `/metrics` override this.
# * `prometheus.io/port`: If the metrics are exposed on a different port to the
# service then set this appropriately.
# * `prometheus.io/param_<parameter>`: If the metrics endpoint uses parameters
# then you can set any parameter
- job_name: "kubernetes-service-endpoints"
honor_labels: true
kubernetes_sd_configs:
- role: endpoints
relabel_configs:
- source_labels:
[__meta_kubernetes_service_annotation_prometheus_io_scrape]
action: keep
regex: true
- source_labels:
[__meta_kubernetes_service_annotation_prometheus_io_scrape_slow]
action: drop
regex: true
- source_labels:
[__meta_kubernetes_service_annotation_prometheus_io_scheme]
action: replace
target_label: __scheme__
regex: (https?)
- source_labels:
[__meta_kubernetes_service_annotation_prometheus_io_path]
action: replace
target_label: __metrics_path__
regex: (.+)
- source_labels:
[
__address__,
__meta_kubernetes_service_annotation_prometheus_io_port,
]
action: replace
target_label: __address__
regex: (.+?)(?::\d+)?;(\d+)
replacement: $$1:$$2
- action: labelmap
regex: __meta_kubernetes_service_annotation_prometheus_io_param_(.+)
replacement: __param_$$1
- action: labelmap
regex: __meta_kubernetes_service_label_(.+)
- source_labels: [__meta_kubernetes_namespace]
action: replace
target_label: namespace
- source_labels: [__meta_kubernetes_service_name]
action: replace
target_label: service
- source_labels: [__meta_kubernetes_pod_node_name]
action: replace
target_label: node
# Scrape config for slow service endpoints; same as above, but with a larger
# timeout and a larger interval
#
# The relabeling allows the actual service scrape endpoint to be configured
# via the following annotations:
#
# * `prometheus.io/scrape-slow`: Only scrape services that have a value of `true`
# * `prometheus.io/scheme`: If the metrics endpoint is secured then you will need
# to set this to `https` & most likely set the `tls_config` of the scrape config.
# * `prometheus.io/path`: If the metrics path is not `/metrics` override this.
# * `prometheus.io/port`: If the metrics are exposed on a different port to the
# service then set this appropriately.
# * `prometheus.io/param_<parameter>`: If the metrics endpoint uses parameters
# then you can set any parameter
- job_name: "kubernetes-service-endpoints-slow"
honor_labels: true
scrape_interval: 5m
scrape_timeout: 30s
kubernetes_sd_configs:
- role: endpoints
relabel_configs:
- source_labels:
[__meta_kubernetes_service_annotation_prometheus_io_scrape_slow]
action: keep
regex: true
- source_labels:
[__meta_kubernetes_service_annotation_prometheus_io_scheme]
action: replace
target_label: __scheme__
regex: (https?)
- source_labels:
[__meta_kubernetes_service_annotation_prometheus_io_path]
action: replace
target_label: __metrics_path__
regex: (.+)
- source_labels:
[
__address__,
__meta_kubernetes_service_annotation_prometheus_io_port,
]
action: replace
target_label: __address__
regex: (.+?)(?::\d+)?;(\d+)
replacement: $$1:$$2
- action: labelmap
regex: __meta_kubernetes_service_annotation_prometheus_io_param_(.+)
replacement: __param_$$1
- action: labelmap
regex: __meta_kubernetes_service_label_(.+)
- source_labels: [__meta_kubernetes_namespace]
action: replace
target_label: namespace
- source_labels: [__meta_kubernetes_service_name]
action: replace
target_label: service
- source_labels: [__meta_kubernetes_pod_node_name]
action: replace
target_label: node
- job_name: "prometheus-pushgateway"
honor_labels: true
kubernetes_sd_configs:
- role: service
relabel_configs:
- source_labels:
[__meta_kubernetes_service_annotation_prometheus_io_probe]
action: keep
regex: pushgateway
# Example scrape config for probing services via the Blackbox Exporter.
#
# The relabeling allows the actual service scrape endpoint to be configured
# via the following annotations:
#
# * `prometheus.io/probe`: Only probe services that have a value of `true`
- job_name: "kubernetes-services"
honor_labels: true
metrics_path: /probe
params:
module: [http_2xx]
kubernetes_sd_configs:
- role: service
relabel_configs:
- source_labels:
[__meta_kubernetes_service_annotation_prometheus_io_probe]
action: keep
regex: true
- source_labels: [__address__]
target_label: __param_target
- target_label: __address__
replacement: blackbox
- source_labels: [__param_target]
target_label: instance
- action: labelmap
regex: __meta_kubernetes_service_label_(.+)
- source_labels: [__meta_kubernetes_namespace]
target_label: namespace
- source_labels: [__meta_kubernetes_service_name]
target_label: service
# Example scrape config for pods
#
# The relabeling allows the actual pod scrape endpoint to be configured via the
# following annotations:
#
# * `prometheus.io/scrape`: Only scrape pods that have a value of `true`,
# except if `prometheus.io/scrape-slow` is set to `true` as well.
# * `prometheus.io/scheme`: If the metrics endpoint is secured then you will need
# to set this to `https` & most likely set the `tls_config` of the scrape config.
# * `prometheus.io/path`: If the metrics path is not `/metrics` override this.
# * `prometheus.io/port`: Scrape the pod on the indicated port instead of the default of `9102`.
- job_name: "kubernetes-pods"
honor_labels: true
kubernetes_sd_configs:
- role: pod
relabel_configs:
- source_labels:
[__meta_kubernetes_pod_annotation_prometheus_io_scrape]
action: keep
regex: true
- source_labels:
[__meta_kubernetes_pod_annotation_prometheus_io_scrape_slow]
action: drop
regex: true
- source_labels:
[__meta_kubernetes_pod_annotation_prometheus_io_scheme]
action: replace
regex: (https?)
target_label: __scheme__
- source_labels: [__meta_kubernetes_pod_annotation_prometheus_io_path]
action: replace
target_label: __metrics_path__
regex: (.+)
- source_labels:
[
__meta_kubernetes_pod_annotation_prometheus_io_port,
__meta_kubernetes_pod_ip,
]
action: replace
regex: (\d+);(([A-Fa-f0-9]{1,4}::?){1,7}[A-Fa-f0-9]{1,4})
replacement: "[$$2]:$$1"
target_label: __address__
- source_labels:
[
__meta_kubernetes_pod_annotation_prometheus_io_port,
__meta_kubernetes_pod_ip,
]
action: replace
regex: (\d+);((([0-9]+?)(\.|$)){4})
replacement: $$2:$$1
target_label: __address__
- action: labelmap
regex: __meta_kubernetes_pod_annotation_prometheus_io_param_(.+)
replacement: __param_$$1
- action: labelmap
regex: __meta_kubernetes_pod_label_(.+)
- source_labels: [__meta_kubernetes_namespace]
action: replace
target_label: namespace
- source_labels: [__meta_kubernetes_pod_name]
action: replace
target_label: pod
- source_labels: [__meta_kubernetes_pod_phase]
regex: Pending|Succeeded|Failed|Completed
action: drop
- source_labels: [__meta_kubernetes_pod_node_name]
action: replace
target_label: node
# Example Scrape config for pods which should be scraped slower. An useful example
# would be stackriver-exporter which queries an API on every scrape of the pod
#
# The relabeling allows the actual pod scrape endpoint to be configured via the
# following annotations:
#
# * `prometheus.io/scrape-slow`: Only scrape pods that have a value of `true`
# * `prometheus.io/scheme`: If the metrics endpoint is secured then you will need
# to set this to `https` & most likely set the `tls_config` of the scrape config.
# * `prometheus.io/path`: If the metrics path is not `/metrics` override this.
# * `prometheus.io/port`: Scrape the pod on the indicated port instead of the default of `9102`.
- job_name: "kubernetes-pods-slow"
honor_labels: true
scrape_interval: 5m
scrape_timeout: 30s
kubernetes_sd_configs:
- role: pod
relabel_configs:
- source_labels:
[__meta_kubernetes_pod_annotation_prometheus_io_scrape_slow]
action: keep
regex: true
- source_labels:
[__meta_kubernetes_pod_annotation_prometheus_io_scheme]
action: replace
regex: (https?)
target_label: __scheme__
- source_labels: [__meta_kubernetes_pod_annotation_prometheus_io_path]
action: replace
target_label: __metrics_path__
regex: (.+)
- source_labels:
[
__meta_kubernetes_pod_annotation_prometheus_io_port,
__meta_kubernetes_pod_ip,
]
action: replace
regex: (\d+);(([A-Fa-f0-9]{1,4}::?){1,7}[A-Fa-f0-9]{1,4})
replacement: "[$$2]:$$1"
target_label: __address__
- source_labels:
[
__meta_kubernetes_pod_annotation_prometheus_io_port,
__meta_kubernetes_pod_ip,
]
action: replace
regex: (\d+);((([0-9]+?)(\.|$)){4})
replacement: $$2:$$1
target_label: __address__
- action: labelmap
regex: __meta_kubernetes_pod_annotation_prometheus_io_param_(.+)
replacement: __param_$$1
- action: labelmap
regex: __meta_kubernetes_pod_label_(.+)
- source_labels: [__meta_kubernetes_namespace]
action: replace
target_label: namespace
- source_labels: [__meta_kubernetes_pod_name]
action: replace
target_label: pod
- source_labels: [__meta_kubernetes_pod_phase]
regex: Pending|Succeeded|Failed|Completed
action: drop
- source_labels: [__meta_kubernetes_pod_node_name]
action: replace
target_label: node
Comments